
Obsidian Canvas Dashboards
Motivation
This is the last in a series of articles, including Freeing Your Thinking and Building a Knowledge Tree, where I talk about using Obsidian as a non-relational database. The main idea is to interact with information, not files, and Obsidian’s core plugins facilitate this approach. I have talked about Search, Bookmarks, Unique Notes and Graph View. This article will describe how to use Canvas to create visual maps of content which not only present information in a clear, attractive and flexible way, but also allow you to explore and interact with your information. As usual, our goal is to obviate the need to open files.
In data science there is a motto “visualize, visualize, visualize.” In the business world, information is commonly presented in the form of a dashboard to allow for visualizing data. A dashboard is a graphical user interface containing views of information. Aside from providing graphical elements and views, a dashboard will typically provide navigational tools and other ways to interact with information and even edit information directly from the dashboard.
Before discussing canvas, I want to mention Excalidraw, an excellent Community Plugin by Zsolt Viczián. It is great for creating visual maps of content with many graphical elements easily available. I highly recommend it. Nevertheless, one of the purposes of this series is to highlight Obsidian’s native tools, and Canvas is quite powerful in its own right.
Canvas
Canvas in Obsidian provides all we need to create dashboards. It allows for the following elements:
- Notes, but more importantly sections and blocks from notes
- Cards, virtual notes which can contain any elements that an ordinary note can and can be converted to an actual note with a mouse click
- Graphics, which can be incorporated independently or as an embed in a Card or Note. They can even be used as backgrounds for groups
- Groups, which provide visual structure and facilitate navigation
- Connectors, which can be directional and annotated, especially good for KanBan style canvases
Visual Maps of Content
Map of Content is a somewhat generic term to refer to a note which includes information from other notes. They can be simple indices of links to related notes, or complete research articles or books, or something in between. The type of MOC depends upon the purpose.
Here I will demonstrate two different types of Visual MOCs. First, an informational dashboard of an academic topic, which could be used by a student or teacher for study or lesson planning. Secondly, a fully interactive dashboard for managing all aspects of my writing and publications. Without leaving the canvas, I can edit both metadata and content of notes.
This workflow relies on three community plugins: Dataview, Metadata Menu and Hover Editor.
Topical Dashboard
Canvases are ideal for pulling together information on a given topic and presenting it in a visually interesting way. As a student, I can accumulate information (not files) on a topic and add it to my canvas. This makes review of the topic easy. As a teacher, such a MOC could provide the basis of a lesson plan, and could even be distributed as course material.
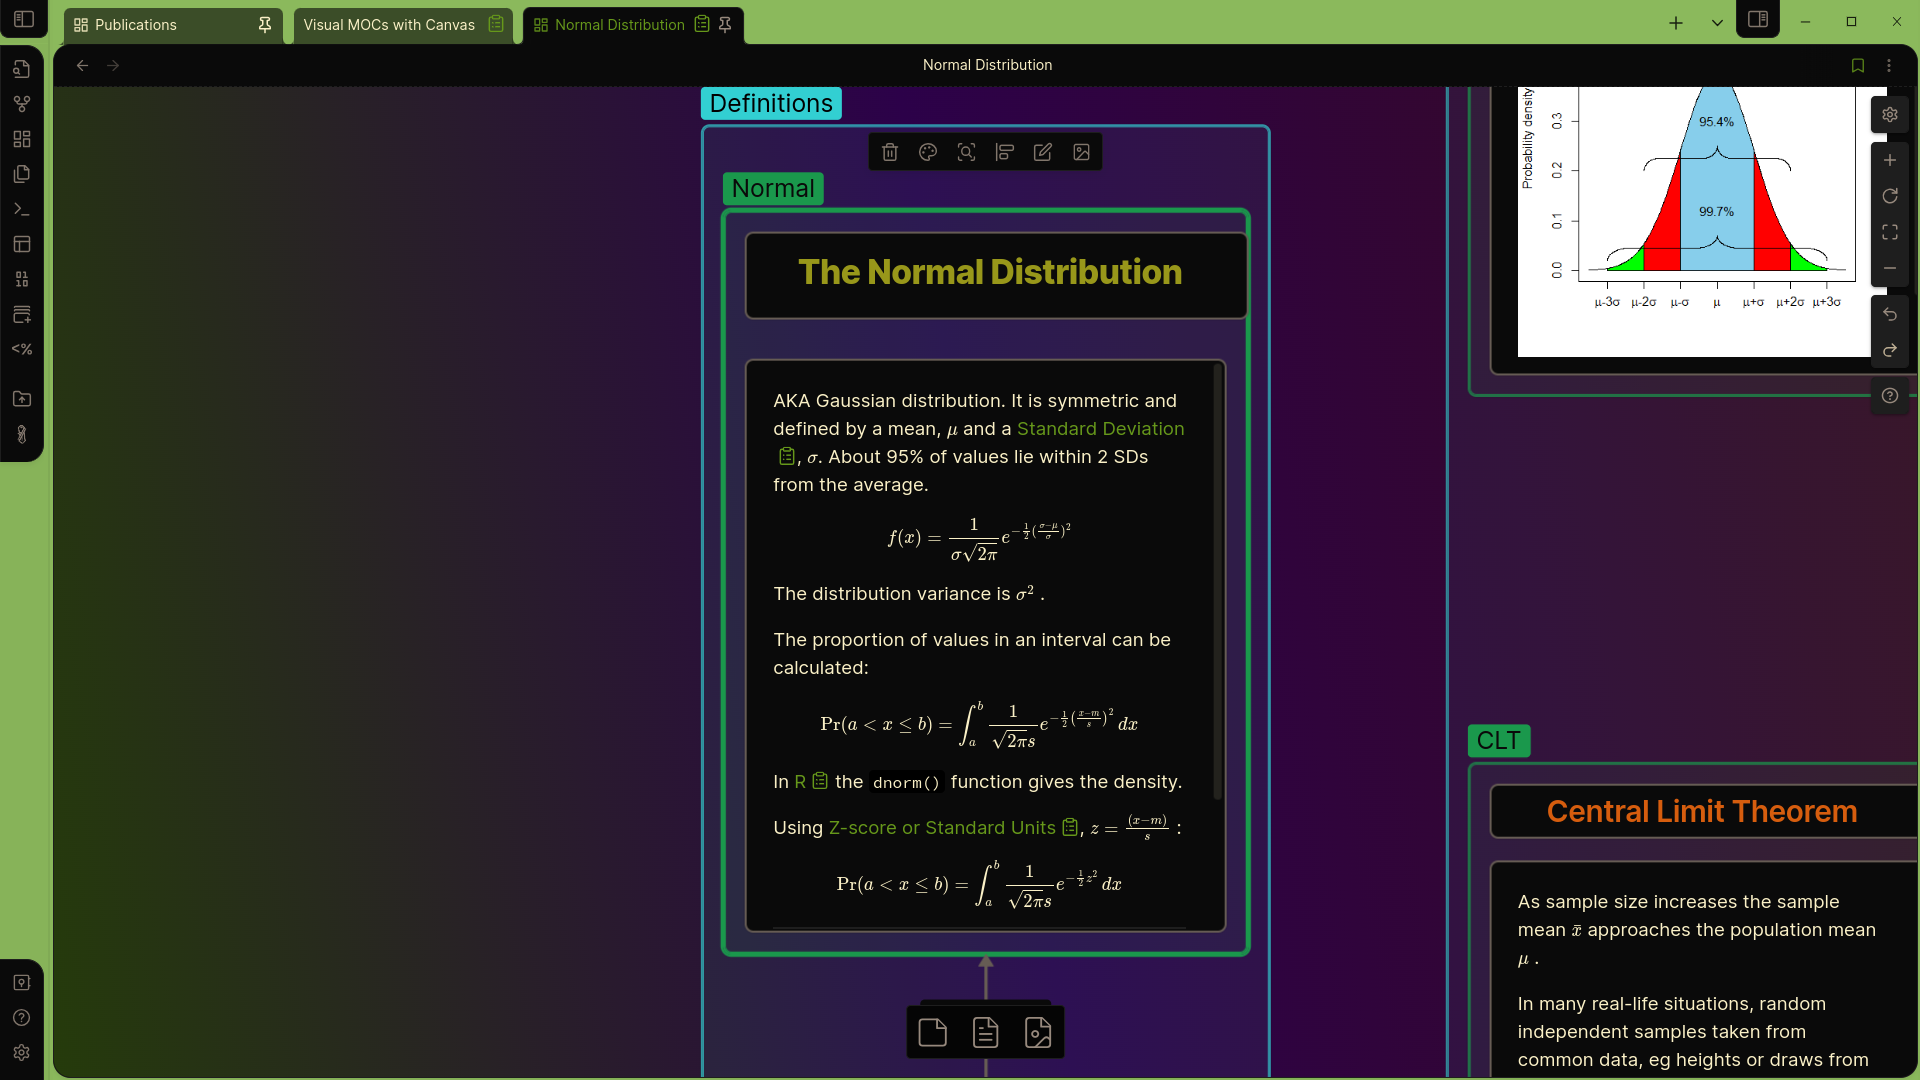
As an example, this is a canvas covering the Normal Distribution, an important topic in probability and statistics.
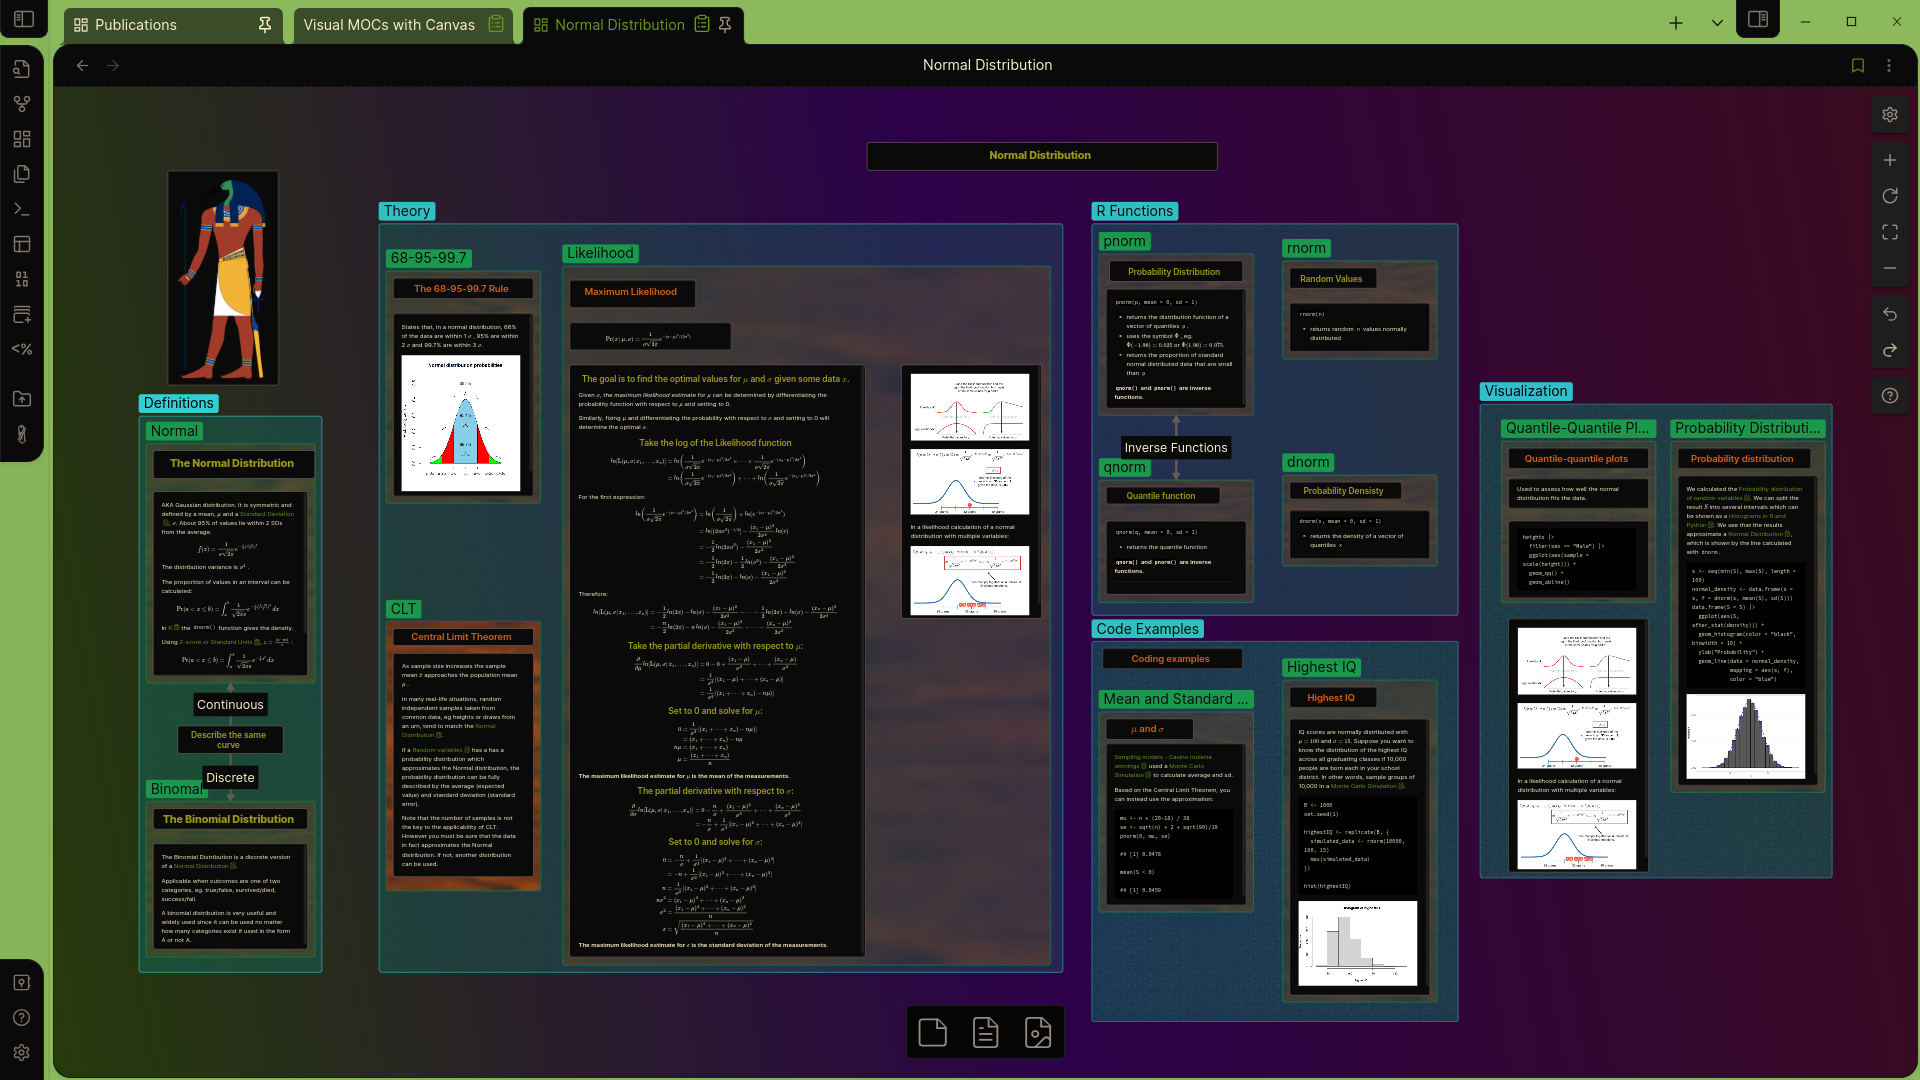
All of my information is grouped in categories. The information itself is drawn from specific sections or blocks within notes, not entire notes. I can navigate the canvas with a convenient drop down, allowing me to jump to a particular section. This is especially convenient on large canvases.
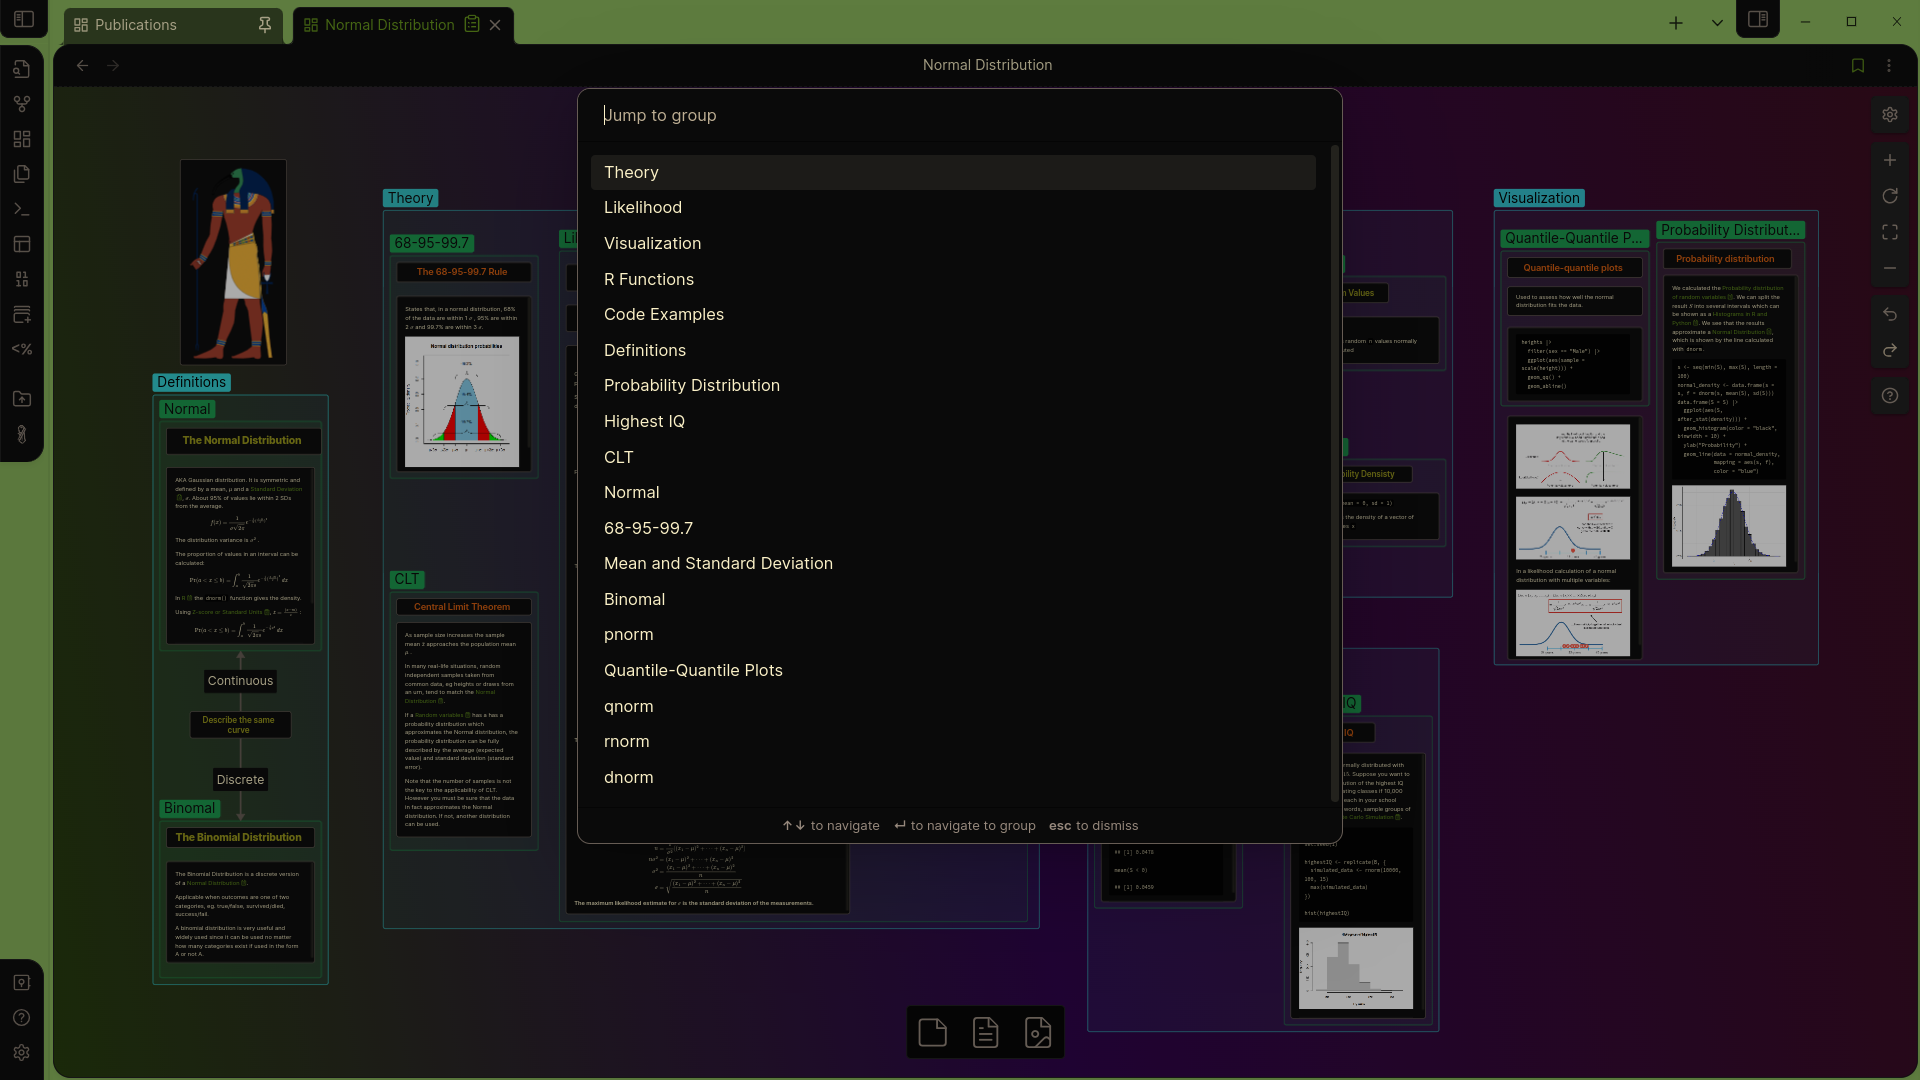
Otherwise I can simply use the mouse to move around the canvas and zoom in and out as I review my information.
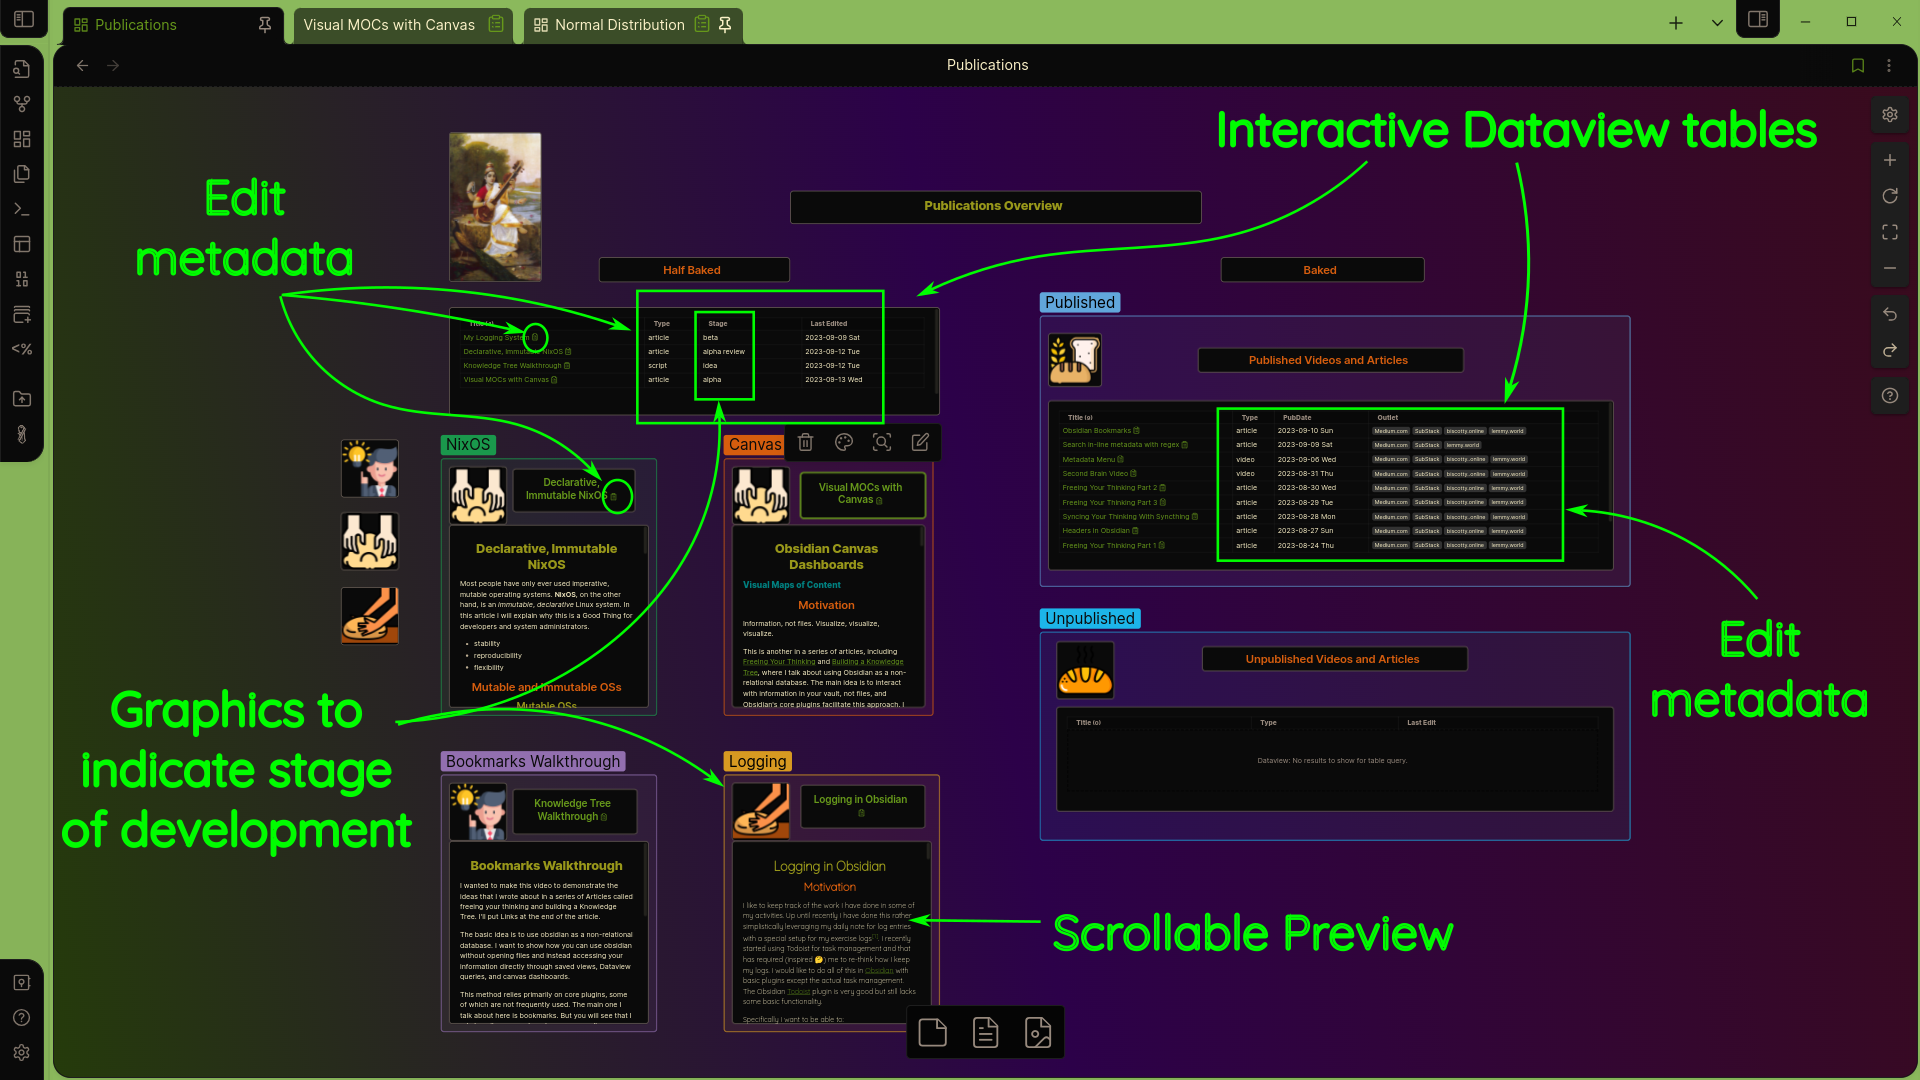
Interactive Dashboard
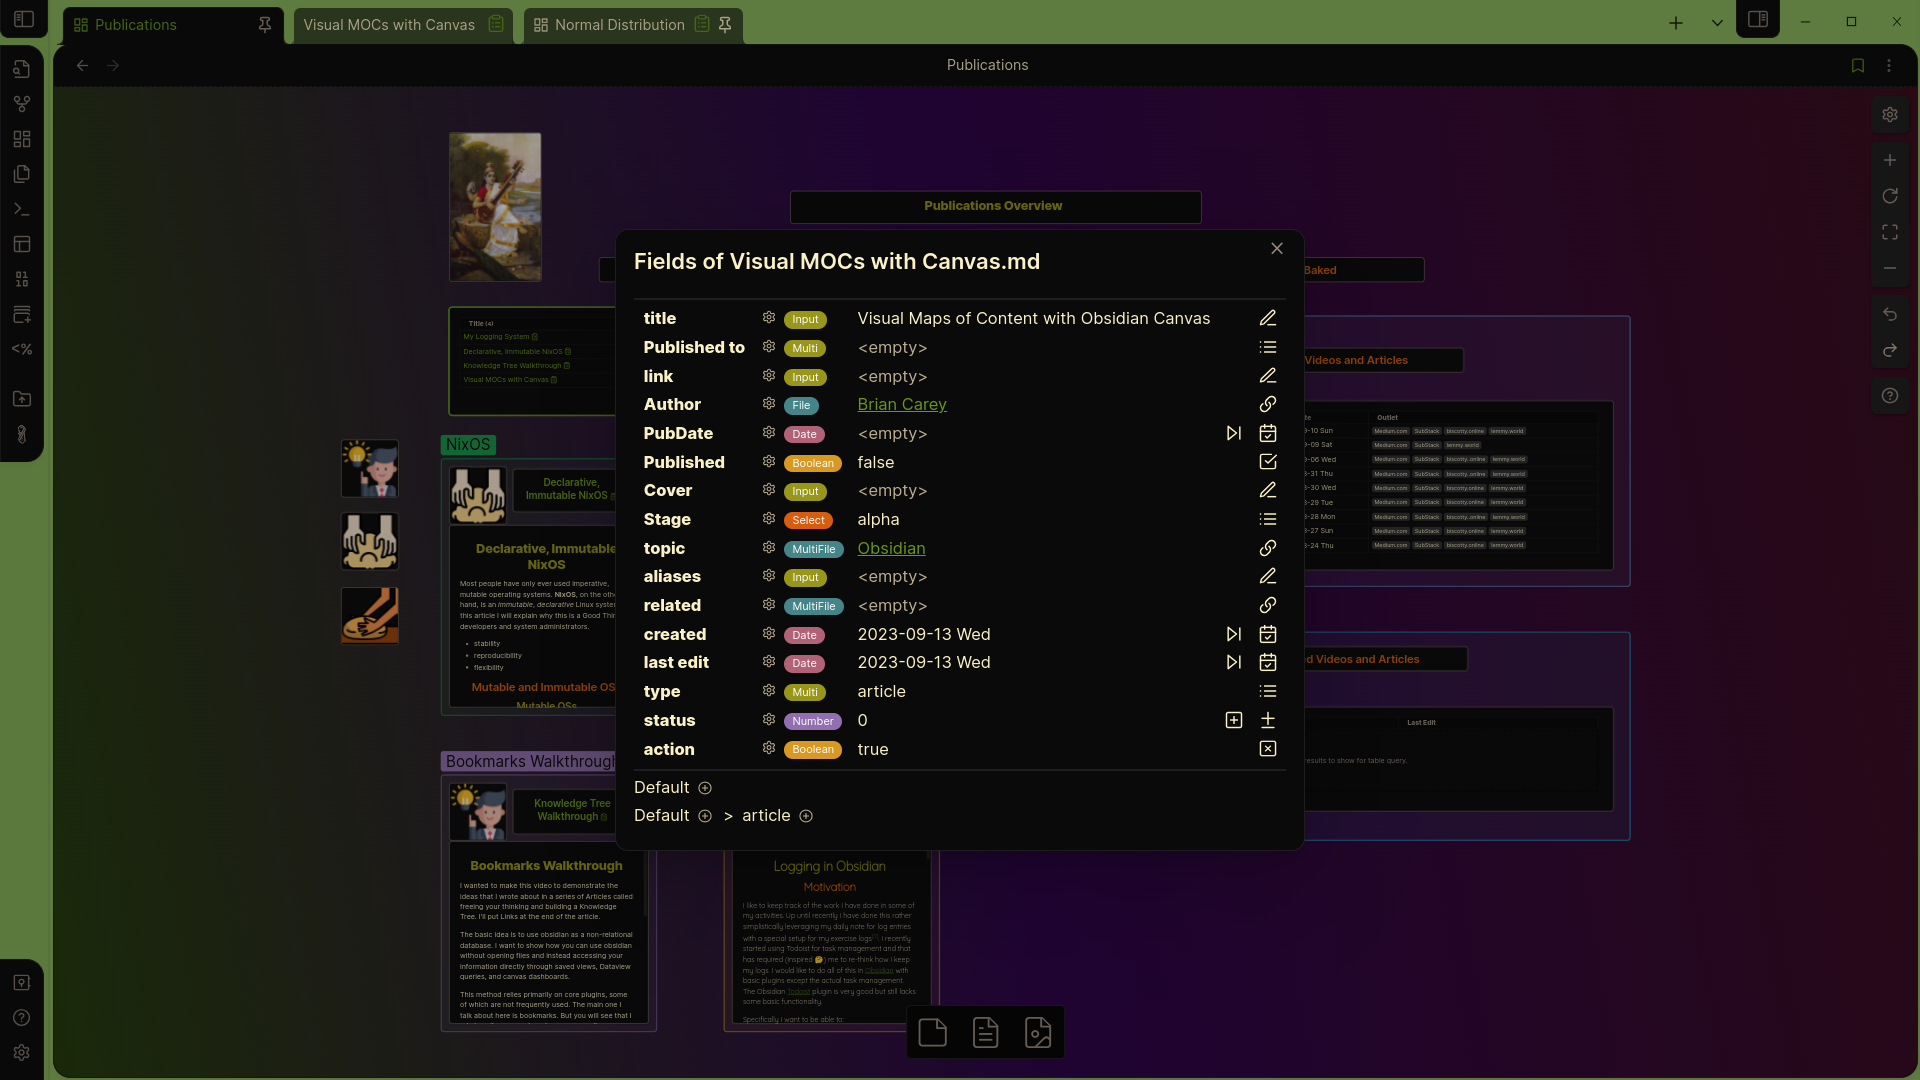
This is an example of using a visual MOC to both present information and also manage information. It includes interactive tables, previews of documents in progress, and graphics to identify the stage of development of each project.
Thanks to Metadata Menu, I can edit the metadata for any document without opening it.
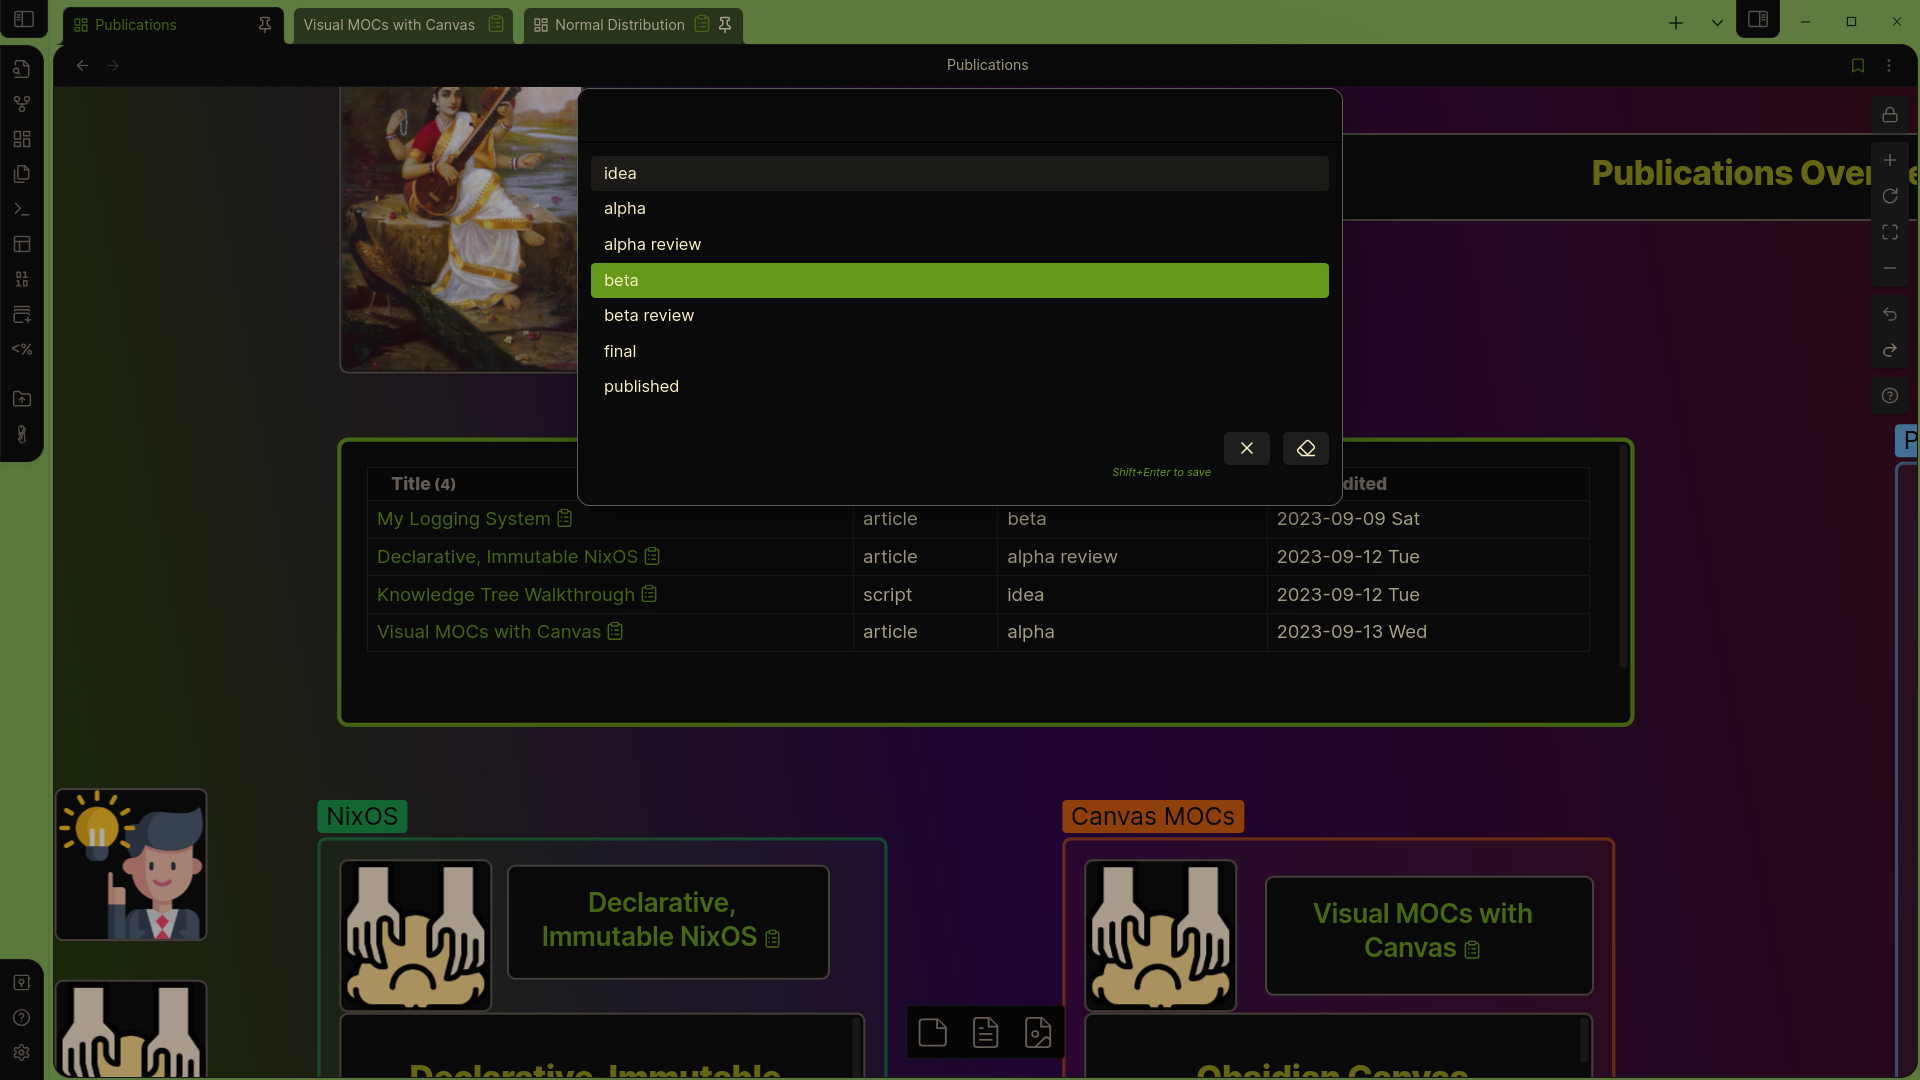
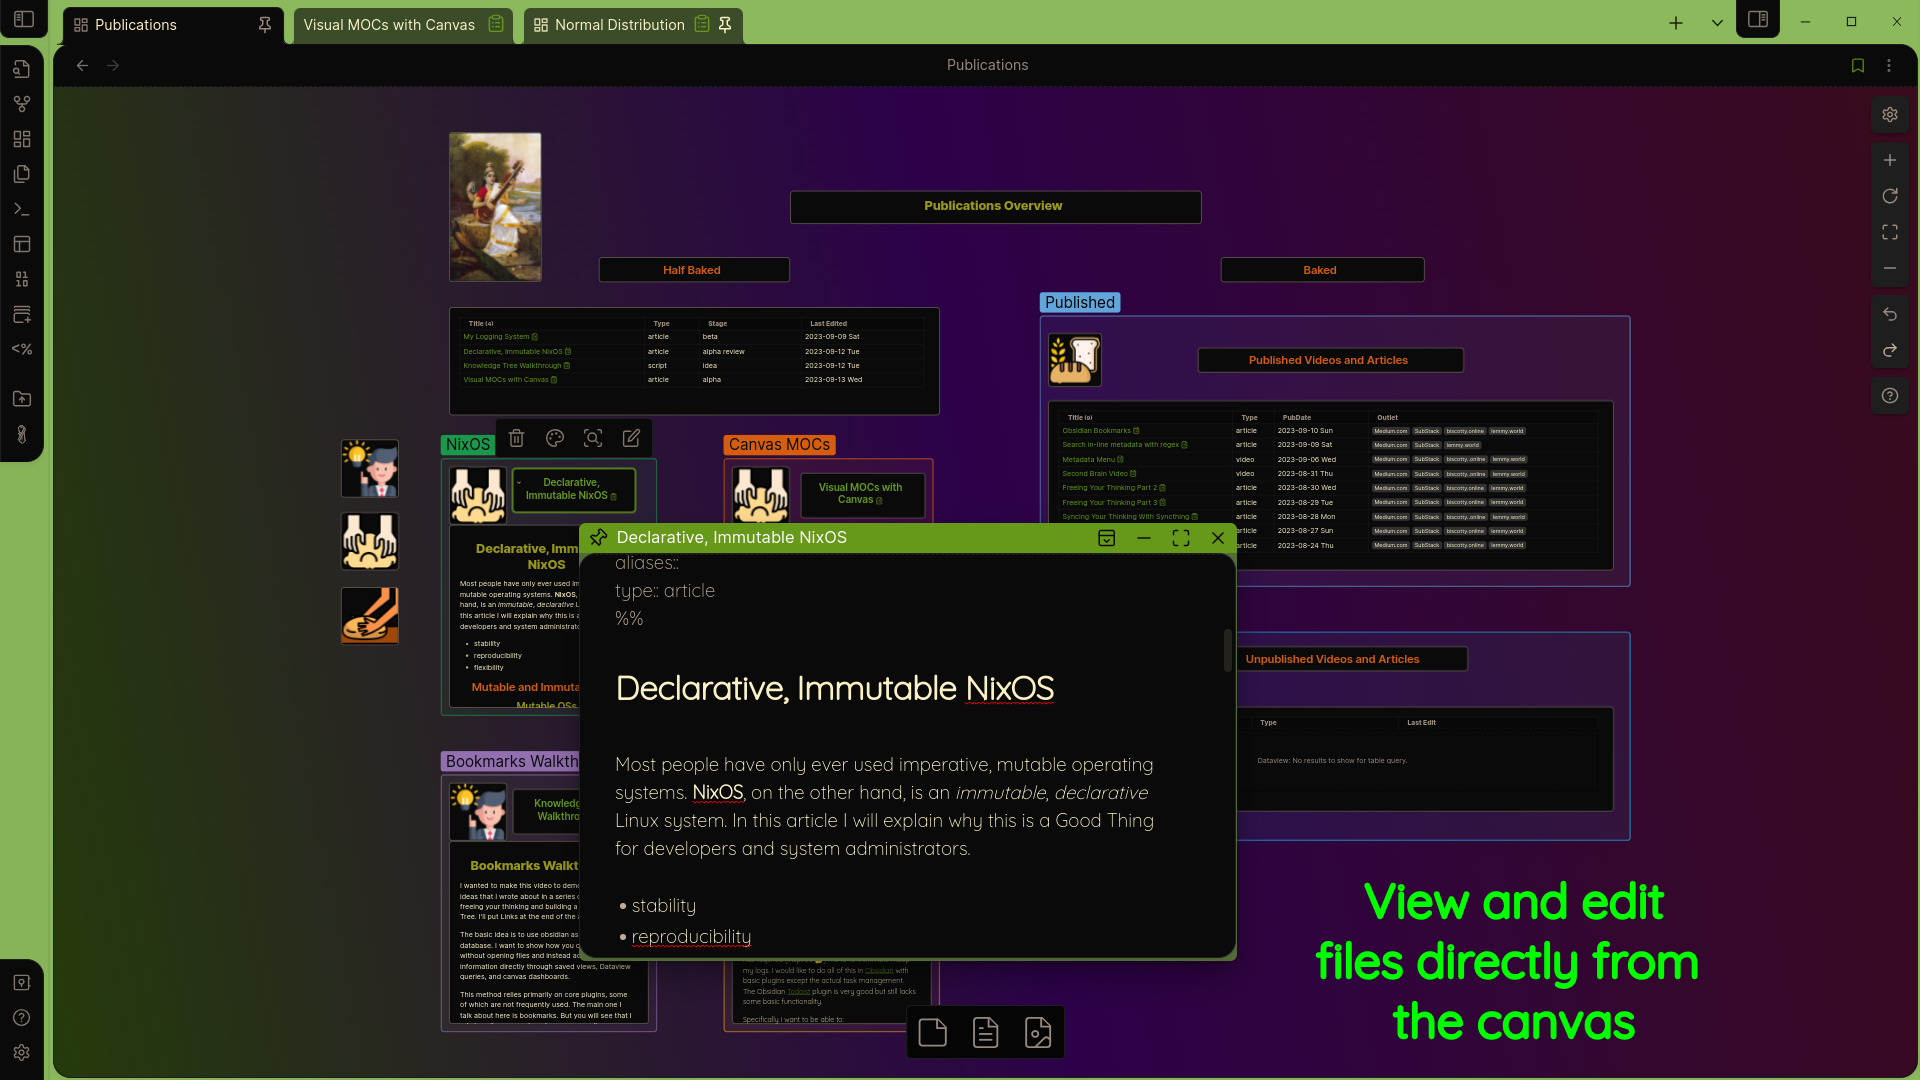
Using Hover editor, I can even edit a document without leaving the dashboard.
Conclusion
This series of articles was meant to introduce the concept of using Obsidian as a database rather than a traditional file editor, with emphasis on Core Plugins. In the first article, I covered creating information without worrying about file names and directories (Unique Notes), and then accessing that information without navigating to or even opening files (Search). In the second, I discussed interacting with Obsidian to organize and analyze information (Graph View and Bookmarks). Most recently, I showed how Bookmarks can be used to create a useful Knowledge Tree using views of information rather than files.
Here I finish with a way to create visually interesting and useful maps of content using Canvas, together with the Community Plugins Dataview, Metadata Menu, and Hover Edge. Again, this allows you to interact with your information as one would a database, without opening files.
I hope you are intrigued enough to try this method. Thank you for reading this, and constructive criticism is always welcome.
Gratitude
I would like to thank some people who have been my muses as I’ve learned Obsidian. They are all good sources of experience and insight.
- Zsolt Viczián
- Sergio (From Sergio)
- Nicole van der Hoeven
- Nick Milo