library(trackeR)
library(sf)
library(dplyr)
library(ggplot2)
library(htmlwidgets)
library(zoo)
DATPAT <- "../../../../data/GPX/"Trail Mapping with R
In the second Python article, we used GeoPandas to convert our list of points to trajectories, which then allowed us to calculate, for example, speeds and durations, path segmentation, etc. Various R libraries exist which I could choose, such as trajectories and trajR . I will use the trackeR library. It is specifically designed to work with sports and activity trackers, and contains functionality far beyond my purpose here, such as biometric analysis.
Conversion to trajectories
The trackeR library doesn’t natively import .gpx files, but it does import .tcx files, another common XML format for sports data. After re-exporting my data from my tracker in .tcx format, I can use trackeR’s read_directory() to import everything
adsf
treks <- read_directory(paste0(DATPAT, "b3/tcx/"), timezone = "GMT")plot(treks)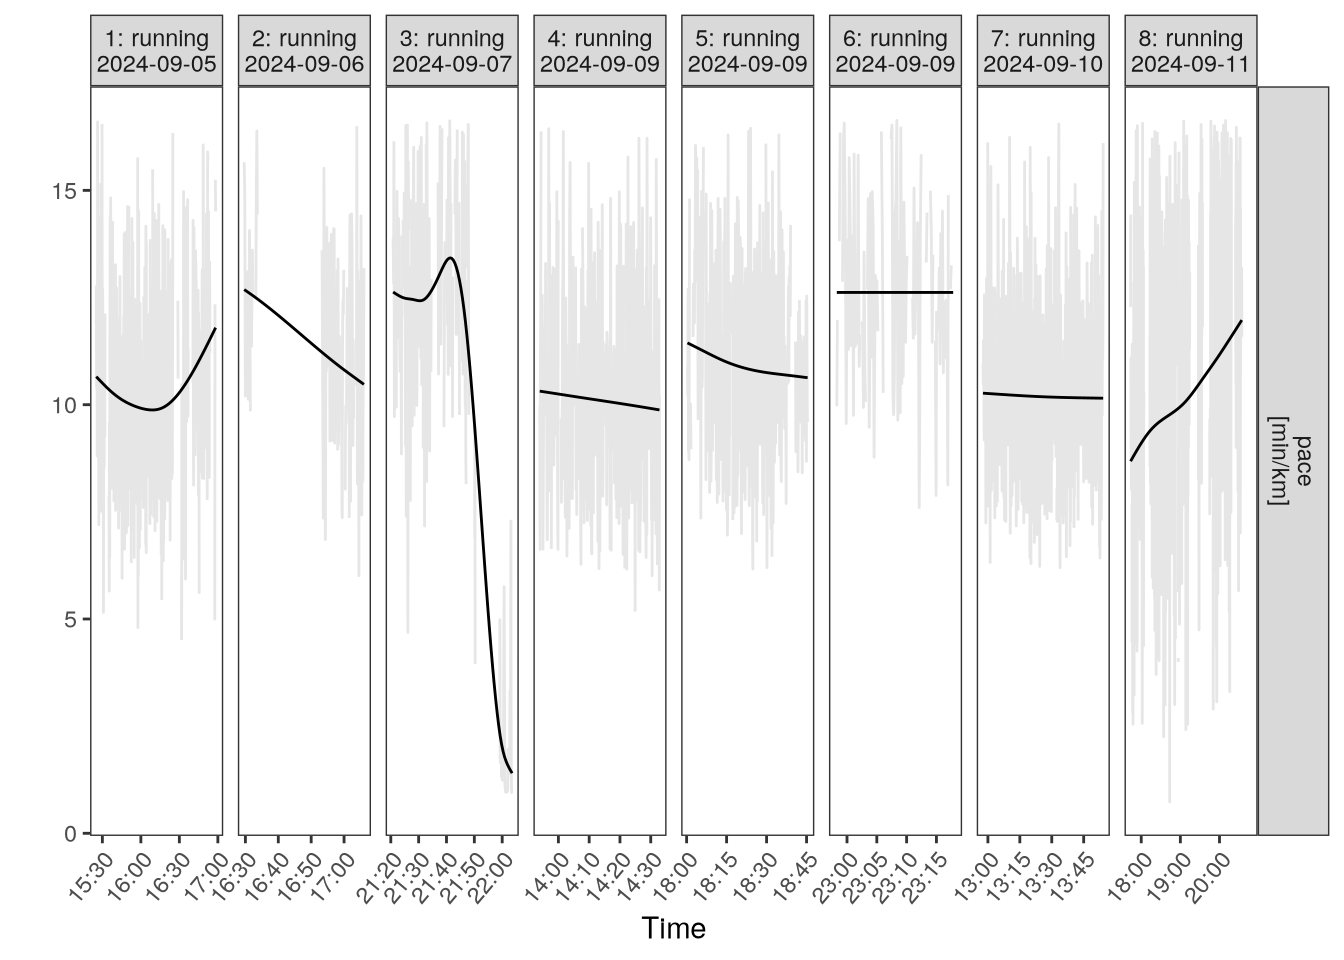
plot(treks, session = 3, what = c("altitude", "pace"))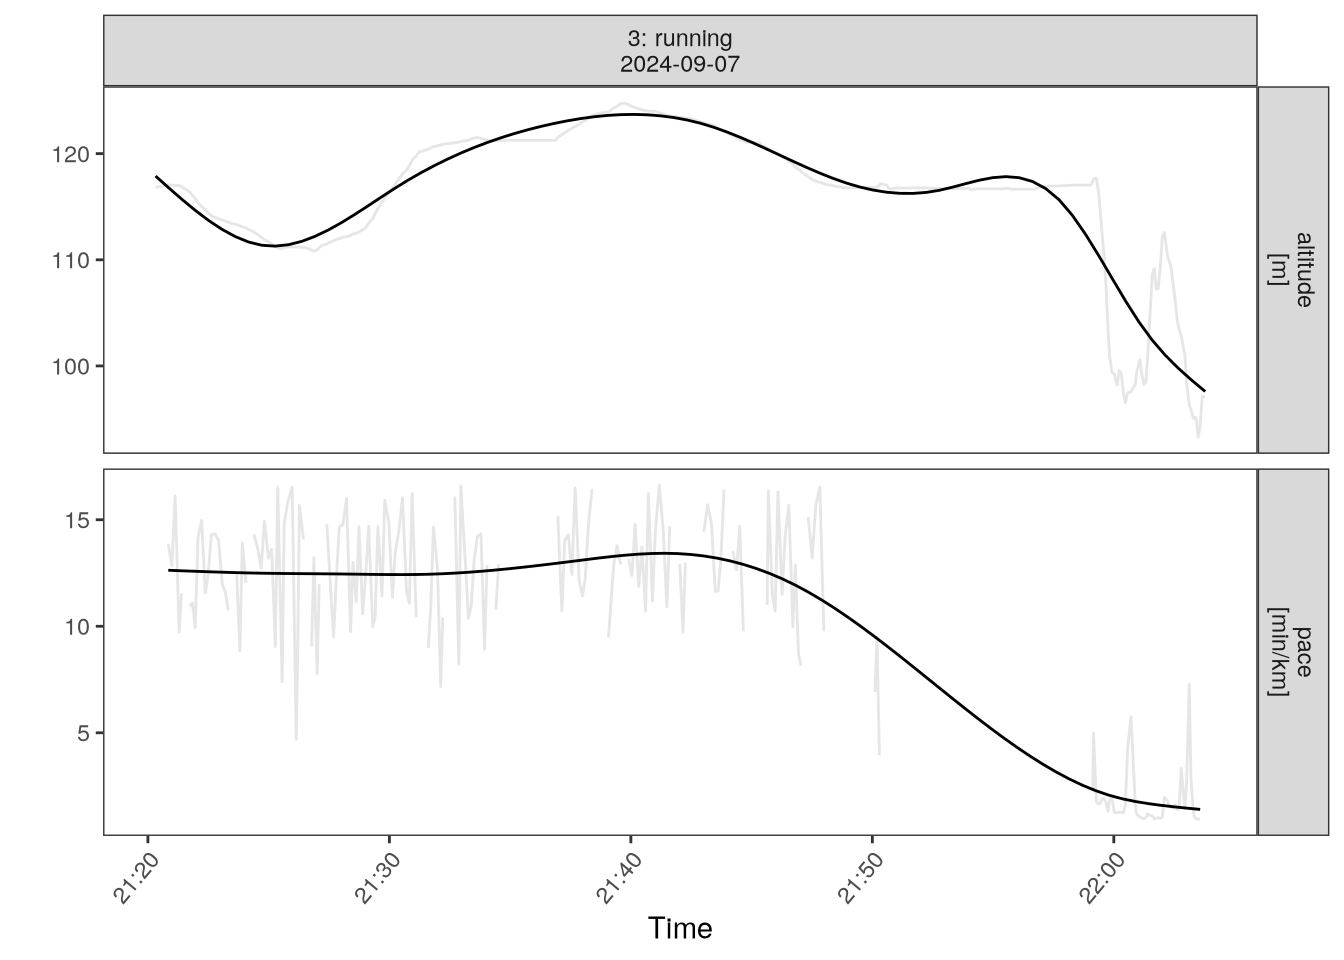
routes_all <- leaflet_route(treks, session = c(1:7))
tryCatch(routes_all, error = function(x) "Failed to donwload map data")saveWidget(routes_all, "routes_all.html", selfcontained = T)tryCatch(leaflet_route(treks, session = c(8)),
error = function(x) "Failed to donwload map data")summary(treks) |>
plot(group = c("total", "moving"),
what = c("avgSpeed", "distance", "duration", "avgAltitude"))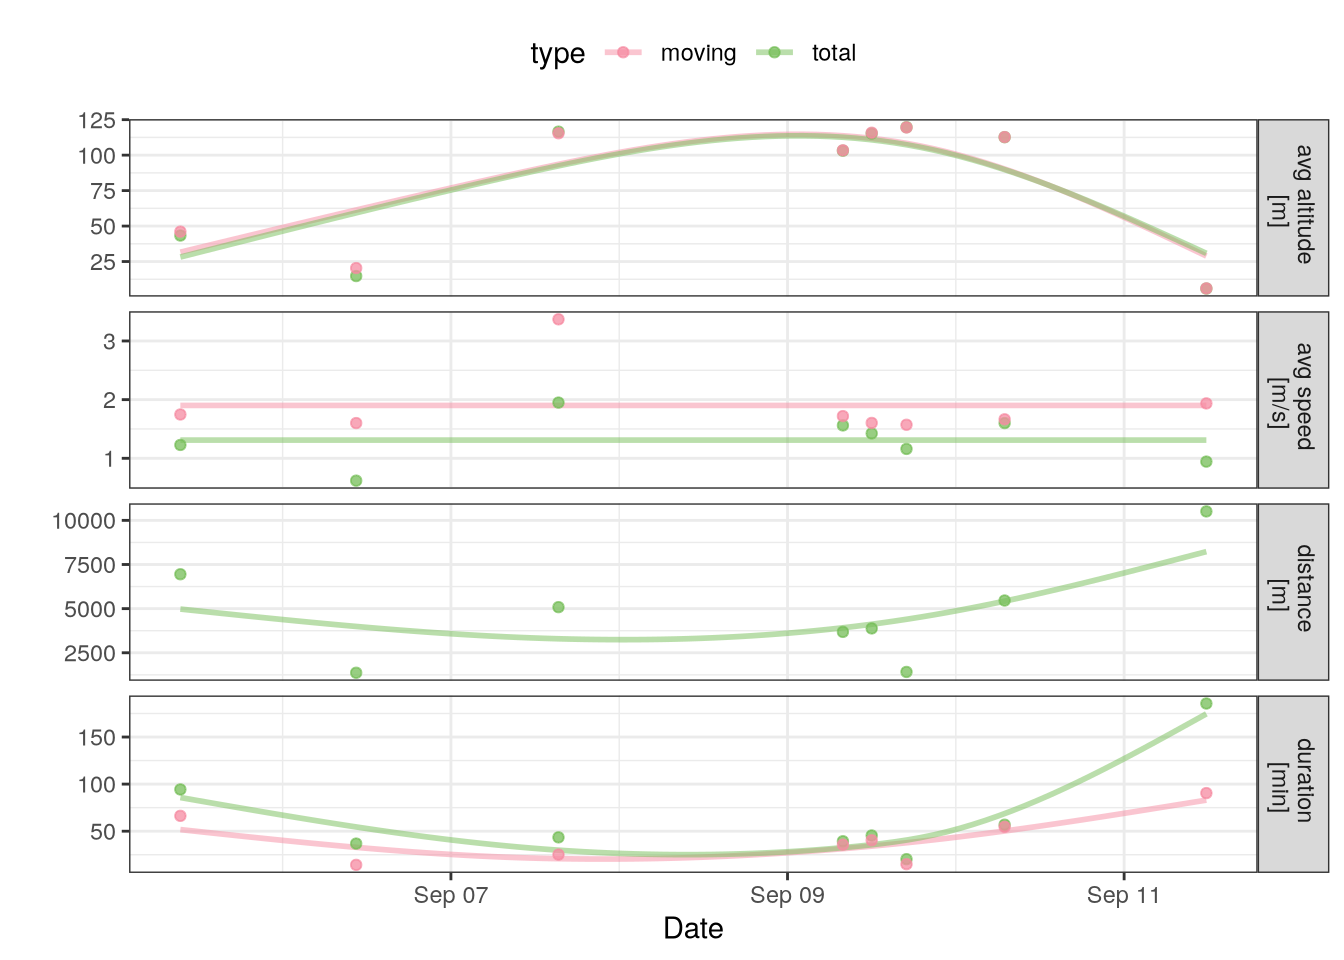
Where at a certain time
treks_sf <- st_as_sf(fortify.zoo(treks[[8]]),
         coords = c("longitude", "latitude"),
         crs = st_crs(4326))
treks_sf
Simple feature collection with 1201 features and 11 fields
Geometry type: POINT
Dimension: XY
Bounding box: xmin: -74.00823 ymin: 40.72404 xmax: -73.98126 ymax: 40.75683
Geodetic CRS: WGS 84
First 10 features:
Index altitude distance heart_rate speed cadence_running
1 2024-09-11 17:43:37 11.34073 0 NA 0 NA
2 2024-09-11 17:43:38 11.34073 0 NA 0 NA
3 2024-09-11 17:43:38 11.34073 0 NA 0 NA
4 2024-09-11 17:43:39 11.34073 0 NA 0 NA
5 2024-09-11 17:43:39 11.34073 0 NA 0 NA
6 2024-09-11 17:43:39 11.34073 0 NA 0 NA
7 2024-09-11 17:43:40 11.34073 0 NA 0 NA
8 2024-09-11 17:43:40 11.34073 0 NA 0 NA
9 2024-09-11 17:43:41 11.34073 0 NA 0 NA
10 2024-09-11 17:43:41 11.34073 0 NA 0 NA
cadence_cycling power temperature pace cumulative_elevation_gain
1 NA NA NA NA 0.009018964
2 NA NA NA NA 0.015594167
3 NA NA NA NA 0.019701965
4 NA NA NA NA 0.021331980
5 NA NA NA NA 0.021331980
6 NA NA NA NA 0.021331980
7 NA NA NA NA 0.021331980
8 NA NA NA NA 0.021331980
9 NA NA NA NA 0.021331980
10 NA NA NA NA 0.021331980
geometry
1 POINT (-73.99116 40.75203)
2 POINT (-73.99116 40.75203)
3 POINT (-73.99116 40.75203)
4 POINT (-73.99116 40.75203)
5 POINT (-73.99116 40.75203)
6 POINT (-73.99116 40.75203)
7 POINT (-73.99116 40.75203)
8 POINT (-73.99116 40.75203)
9 POINT (-73.99116 40.75203)
10 POINT (-73.99116 40.75203)i <- as.POSIXct('20240911 124341')
treks_sfplot(zones(treks[1:3], what = "speed", breaks = c(0, 2:6, 13)))Distance from book stores
Stop detection
asdflkj